SAmple Stock Chart
How it works
Our strategy is based on identifying the trading behavior of the successful, “smart money” institutional investors and using it as our guide. All the data we need is contained in stock chart data, waiting to be interpreted.
WHEn to Trade
SPX Corp (SPXC) Case Study
Typical of the stocks in our newsletter is SPX Corp (SPXC). It is in the industrials category and specifically the machinery & components sector.
The following charts show weekly price action over the past 20 months (87 weeks).
This first chart shows the results of having BOUGHT shares 20 months ago and still holding, as many passive investors likely have:
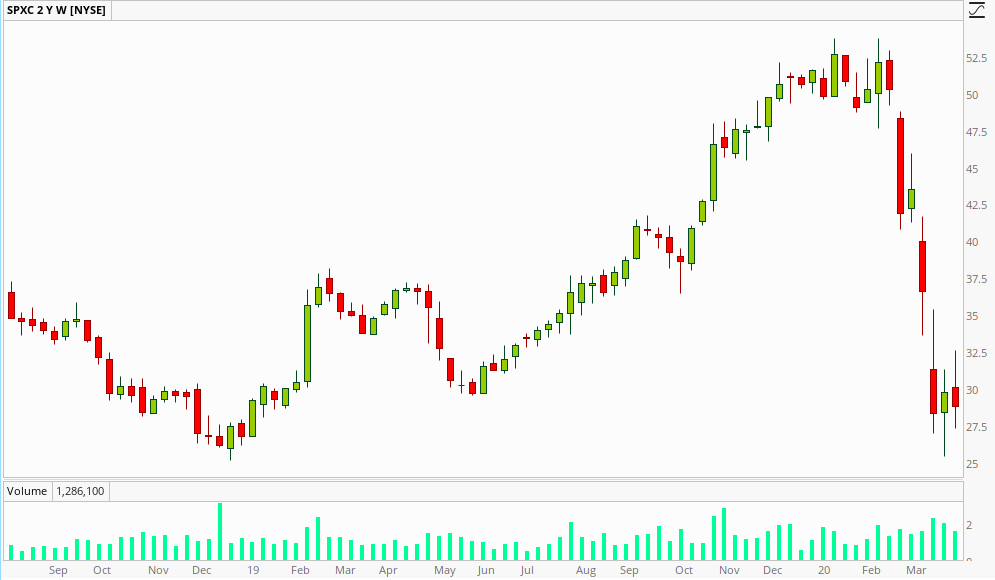
Notice the mini-trends – investors immediately lost money . . . but over time recovered . . . only to have a brief setback . . . then finally earn a very large gain . . . only to given it back recently, and then some. Their 20 month return: -21.0%
Here’s the same chart, with just the BUYs and holds (“long” positions) suggested by our analytics, indicated in green:
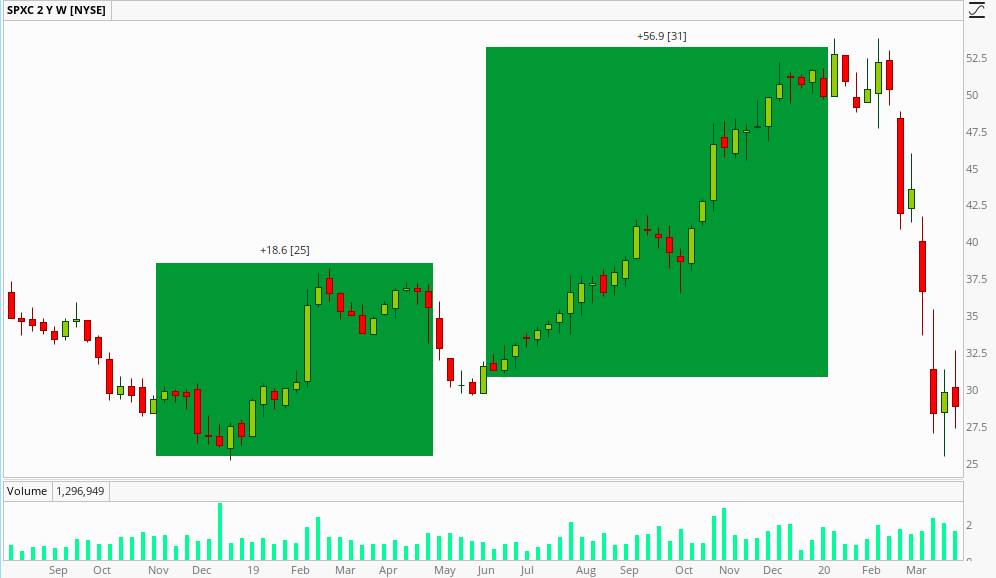
The first long trade resulted in a gain of +18.6% in 25 weeks, the second long trade resulted in a gain of 56.9% in 31 weeks. From these two trades alone, comprising only 56 of the 87 weeks, each $1 invested became $1.18, then re-invested became $1.86, for a total return: +86.0%.
Here’s the same chart, with the SELL SHORTs and holds (“short” positions) suggested by our analytics, indicated in light blue, added to the long positions:
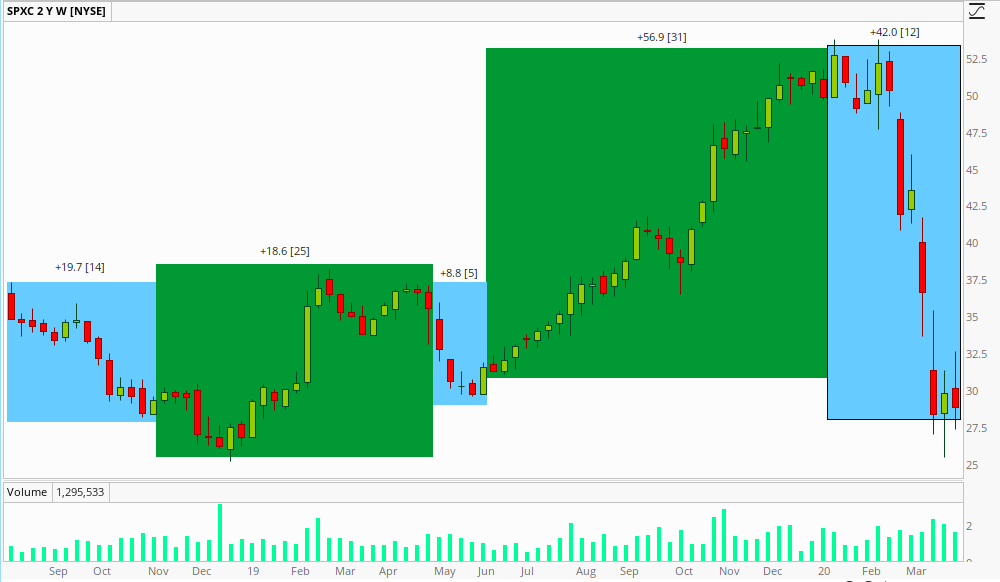
The first short trade resulted in a gain of +19.7% in 14 weeks, the second short trade resulted in a modest gain of +8.8% in 5 weeks, and the recent short trade has produced a gain-to-date of +42.0% in 12 weeks. Adding these trades to the long trades, each $1 invested became $1.19, then $1.41, then $1.54, then $2.42, and now $3.44, when re-invested each time. Total return: +244.1%
These different returns were all possible in the same stock, over the same time period. The difference? The investment strategy, and the difference is huge. Which one would best help you reach your financial goals – a loss of -21 %, a gain of +86%, or a gain of +244% ?
Testimonial
“I like the fact this newsletter tells me precisely what to do with each stock each week. Makes for a quick read. So different from others I’ve tried that were very vague.”
Emily Y., Level 2 Subscriber
Get a free Newsletter Sample
Send us an email